Cube-based Financial Reporting
Challenges
Our client had an aging set of 57 financial reports which they wanted to be both consolidated and extended to have more capabilities. In particular, they wanted to report against data outside the Departmental Budget system, including data from Financial Aid and University Budgeting. Also, they had a previous investment in data cube technology which they wanted to leverage to improve report performance.
Key Features
- The data cube integrates data from multiple sources, and is refreshed every night.
- 18 financial reporting, financial planning, analysis and exception reports replaced a suite of reports from older reporting software, and 16 new reports were created. Reports have user parameters which allow for thousands of report variations, with varying levels of detail and report filters.
- Summary Reports have drill-down capability to lower level reports, and ultimately to detail transactions.
- In addition to report suite, the data cube is accessible through 3rd party tools, such as Excel PowerPivot.
- Detailed security is implemented inside the data cube, so it applies to all queries and reports.
Results
- Existing reports are significantly more powerful than they were previously as the new reports give management insights that were not previously available. For instance, Financial Aid reports improve control by combining student population, actual and planned aid, budgeted aid, sources, uses, and fund balances. Since Financial Aid comes from so many different sources and are administered by various entities (including the School, the University, and 3rd parties) that it was previously very difficult to get an integrated picture.
- Reports run quickly and are accessible to all users via SharePoint. They can be printed or exported in a wide variety of formats, including PDF and Excel.
- Reports run against a single data source, so they are consistent with each other.
- Reports are carefully and consistently formatted, indicating parameters used, data source currency, and the date the report was run and by whom. Many of the reports are formatted as financial statements that are suitable for wide distribution.
Our Solution
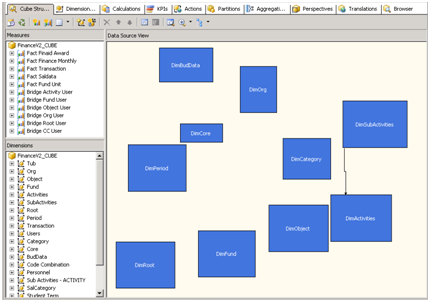
Transaction and summary data going back 12 months is Extracted nightly from Departmental and University budget, general ledger, and financial aid systems, Transformed using SQL Server Database Engine into cube-ready tables, and Loaded in minutes to a SQL Server Analysis Services (SSAS) cube which is optimized for financial reporting.
A large suite of reports are implemented using SQL Server Reporting Services (SSRS) and MDX, and deployed via SharePoint.
Data security is table-driven and resides entirely in the cube, right down to limiting which of 180,000 detail code combinations any user can or cannot see. Report parameters are driven by the cube, so the report choices available to users reflect this cube-based security. Security operates like a traditional database view, where data that a given user is not entitled to see is invisible, so that when users connect with Excel PowerPivot for ad-hoc reporting the security is still in effect.
